
What CPI Actually Is — and Why a 0.6% Print Moves Your Mortgage Rate
What CPI Actually Is — and Why a 0.6% Print Moves Your Mortgage Rate
Short answers: CPI is the Consumer Price Index, the Bureau of Labor Statistics' monthly read on what American households pay for a representative basket of goods and services. The September 2026 CPI printed on October 14, 2026 at +0.6% for the month / 3.7% over the year, with core at +0.3% / 2.6% — a tenth of a point hotter than expected on both. Inflation hits your mortgage rate because bond investors price Treasury yields off inflation expectations, and mortgage rates price off Treasury yields and mortgage-backed securities. Right now the Freddie Mac 30-year average sits at 7.40% (week ended October 15, 2026), and the Fed meets October 27–28. (All rate figures below carry the date and term; NMLS #1680719.)
What is CPI, really? It's a weighted basket, not a single price
The Consumer Price Index is not a measure of "inflation" as some abstract force. It's a very concrete piece of bookkeeping. Each month, the BLS collects prices from 75 urban areas, roughly 6,000 housing units, and about 23,000 retail establishments — the same stores, rents, and service providers tracked over time. The result is a weighted basket representing what urban American consumers actually spend money on, organized into categories: food, energy, shelter, apparel, transportation, medical care, and more.
The weighting is the part most coverage skips, and it's the part that matters most. Not everything in the basket counts equally. Shelter — rent plus owners' equivalent rent, the BLS's estimate of what homeowners would pay to rent their own homes — makes up about 35–36% of the entire index. Gasoline, by contrast, is roughly 3% of the basket. So a huge swing in gas prices makes headlines but moves the index less than its noise suggests, while a quiet 0.4% monthly rise in shelter quietly does the heavy lifting — and in September, shelter did exactly that (+0.4% for the month, +3.2% over the year; owners' equivalent rent +3.3% over the year).
September CPI printed October 14, 2026 (USDL-26-1574): +0.6% for the month / 3.7% over the year; core CPI (the index with volatile food and energy stripped out) at +0.3% / 2.6%. Dow Jones and FactSet surveys had expected 3.6% and 2.5% — so both came in a tenth hotter. Gasoline's 9.1% monthly jump accounted for over half of the all-items increase; shelter rose 0.4% and added its steady weight. Nothing in this print suggested inflation was cooling on its own.

That weighting is the distinction that matters: gasoline is ~3% of the basket but moves the headline; shelter is ~35% and moves the trend. Core — the index with food and energy stripped out — is the underlying read, which is why economists and the Fed watch it most closely.
How does a CPI print become your mortgage rate? Follow the chain
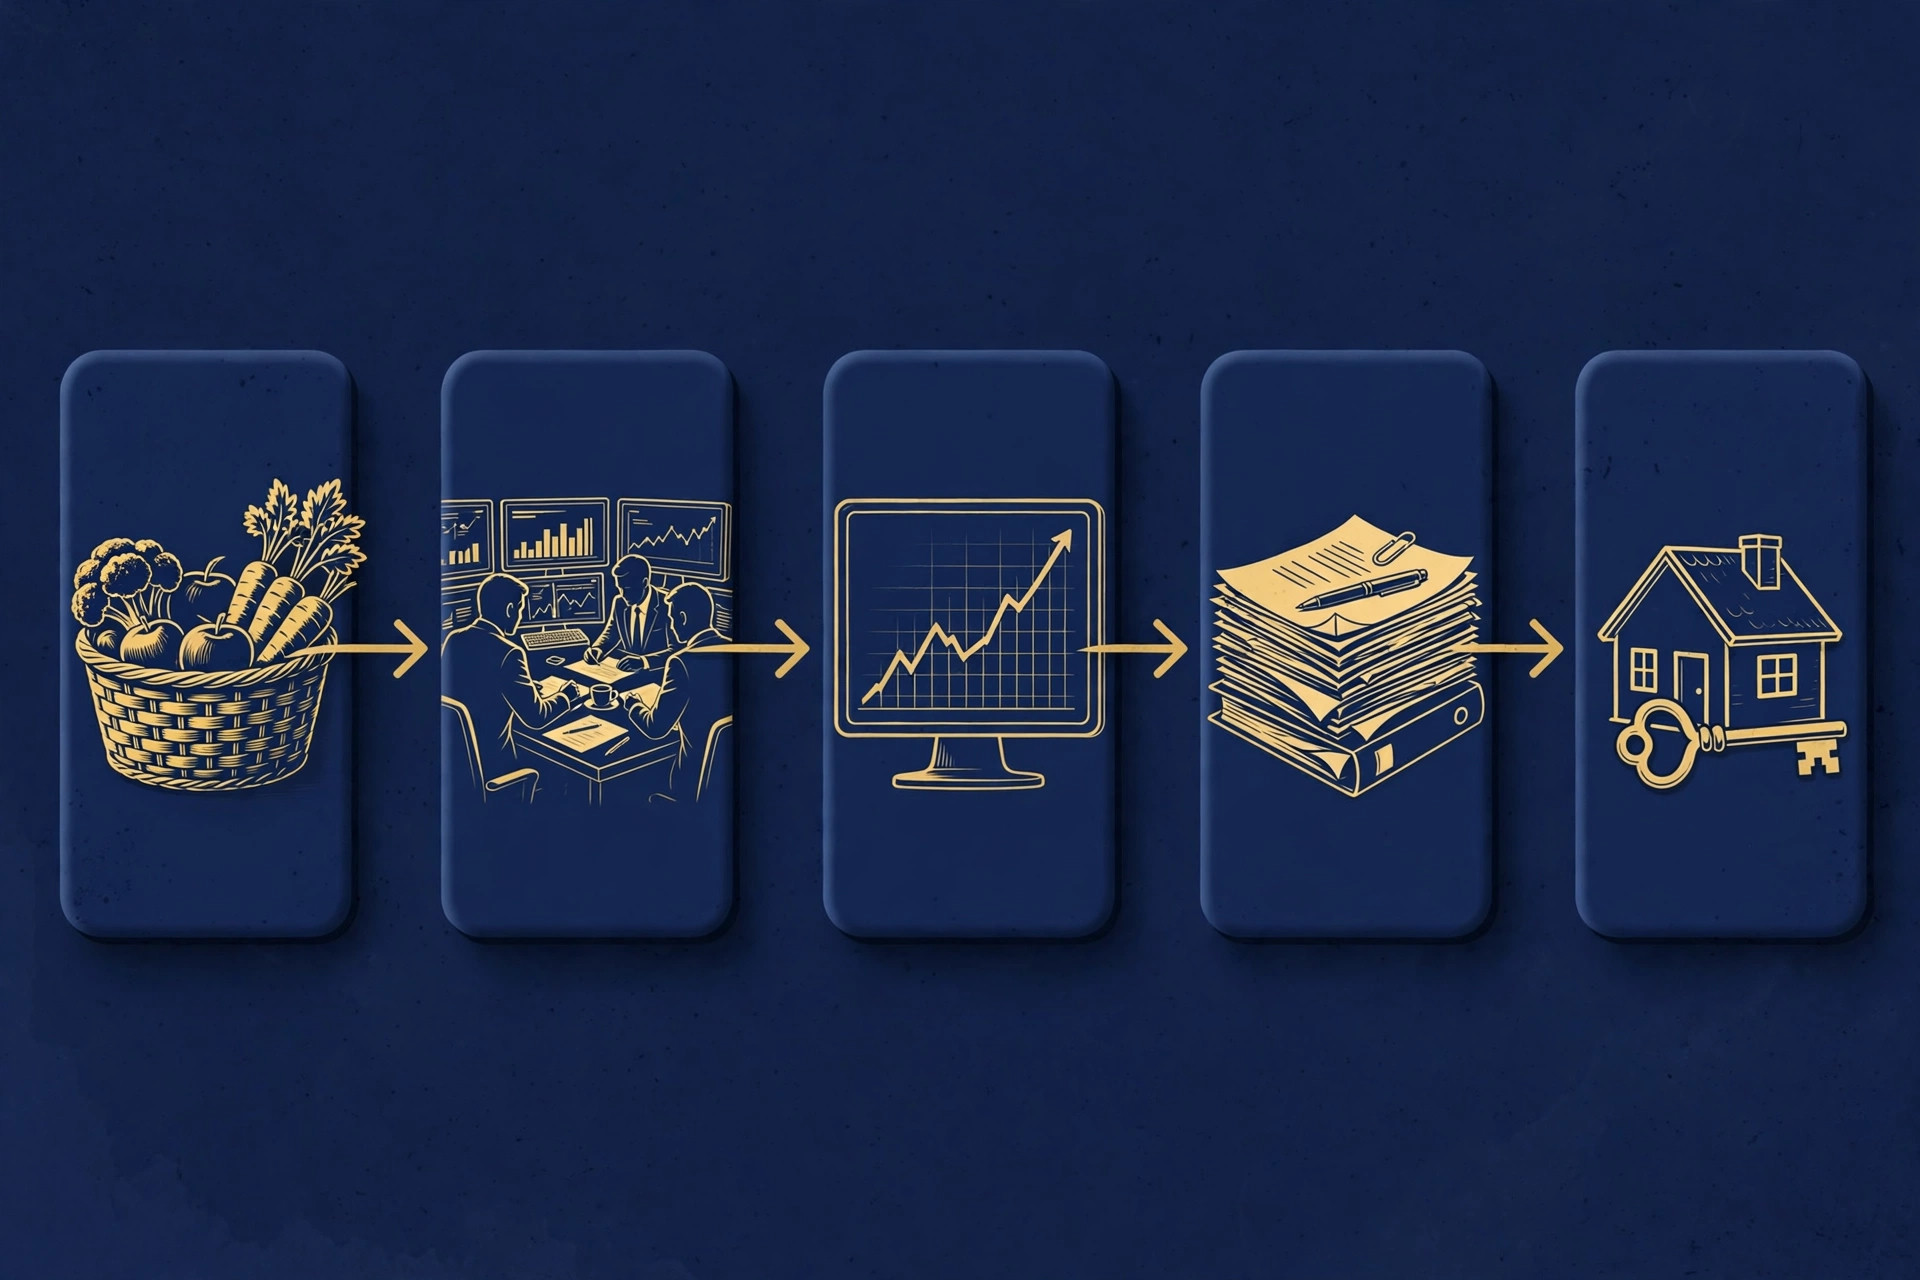
This is the mechanism, step by step:
- CPI prints. A hotter-than-expected number — like September's 3.7% versus the 3.6% economists expected — tells investors that inflation is stickier than priced in.
- Bond investors reprice. The 10-year Treasury is a fixed stream of future payments. If inflation runs hotter, each future dollar buys less — so investors sell bonds, bond prices fall, and yields rise.
- Mortgage-backed securities follow. A mortgage is a long-dated loan, and investors who buy pools of mortgages demand yields competitive with Treasuries plus a spread for risk. When Treasury yields climb, mortgage investors demand more too.
- Lenders pass it through. The rate you get quoted is the wholesale investor yield plus the lender's margin — origination costs, servicing value, hedging. When the wholesale side reprices, retail rates move within days.
The 10-year Treasury stood at roughly 5.10% at its October 15 close (per FRED). The Freddie Mac weekly survey put the 30-year fixed average at 7.40% for the week ended October 15, 2026, unchanged from the prior week, and the 15-year at 6.71%.
But zoom out one level and you see what the inflation repricing did. From late August to early October, the Freddie Mac 30-year average climbed seven weeks in a row: 6.66% → 6.71% → 6.76% → 6.95% → 7.03% → 7.28% → 7.40% — a 74-basis-point climb in about six weeks, ending the streak only in the week of October 15. A year ago, the same measure was 6.27%.
Notice something important: a 0.1% CPI surprise does not mechanically produce a fixed rate move. Rates move on the whole data flow — CPI, jobs reports, the Fed's own actions, geopolitical risk premiums, investor positioning — not on one print alone. What a hotter print does is shift investors' odds: higher chances the Fed holds or hikes at its next meeting. That's what the coverage described after the September print — bond markets repricing and the odds of another Fed move at the October 27–28 meeting rising.
Where do consumer confidence and spending fit in?
CPI measures prices that have already been paid. The fuel for future prices is consumer behavior — spending and the confidence behind it. When consumers keep spending strongly, businesses discover they can raise prices without losing customers. Economists cited in the September CPI coverage pointed to strong consumer demand in categories like travel as one of the upward pressures, alongside tariffs, the AI data-center buildout, and the energy shock. Confidence is the accelerant: households that feel secure spend; spending sustains price pressure.
The Fed watches this loop explicitly: if households and businesses expect higher prices, they behave in ways that create them (workers demand raises, firms preemptively mark up). And the spending shows up directly in future CPI prints: holiday-season spending — the heaviest consumer-spending quarter of the year — flows into the November and December CPI data, which is why investors price that calendar effect in advance.
Why the calendar matters: fiscal year, holidays, and the next two dates
The new federal fiscal year began October 1, and the holiday season it contains is a data season as much as a shopping season — October, November, and December spending flows into the CPI prints released in November, December, and January, and bond investors price that calendar effect in advance.
Two dates to put on your mental calendar:
- October 27–28: the Fed's next policy meeting. The federal funds rate sits at 3.75%–4.00% after the September 16 increase. The September CPI gave the Fed a hotter inflation read to weigh against employment data. This meeting doesn't set mortgage rates directly — the Fed sets overnight rates, not 30-year mortgage rates — but its statement and the Chair's press conference reshape investor expectations, and expectations move the 10-year, which moves your quote.
- Mid-November: the October CPI release. Between now and then, rates trade on expectations about that print — housing starts, jobless claims, consumer sentiment, and oil prices all feed the guessing.

This is why rate-lock strategy is a calendar game as much as a numbers game. Nobody knows what the October 27–28 meeting produces or what mid-November's CPI says — but we know when the decision points arrive, and we can be positioned before they do.
What happened after past CPI prints? The dated receipts
Let's look at the actual record — three prints, three reactions. A print never acts alone, but the direction of the surprise and the direction of rates rhyme.
August 12, 2026 — the July CPI print: +0.1% for the month, 3.4% over the year; core +0.2% / 2.5%. A soft print, the kind that gives the bond market relief. The Freddie Mac 30-year average sat at 6.66% in the weeks that followed (week ended August 27) — the calm before the climb.
September 11, 2026 — the August CPI print: +0.4% for the month, 3.4% over the year; core +0.3% / 2.4%. Headline came in warm on the month, and core stayed stubborn. The following week, the Freddie Mac average jumped from 6.76% to 6.95% (week ended September 17), then to 7.03% the week after. Honest accounting: that print didn't act alone — the Fed's September 16 rate hike to 3.75%–4.00% landed in the same window. But the direction rhymed: hotter inflation data, higher rates.
October 14, 2026 — the September CPI print: +0.6% for the month, 3.7% over the year; core +0.3% / 2.6%. A tenth hotter than expected on both headline and core. The market reaction described in the coverage: bond markets repriced, and the odds of another Fed move at the October 27–28 meeting rose. The weekly Freddie Mac survey printed 7.40%, unchanged for the week ended October 15 — but remember, that survey measures the prior week. The day-to-day repricing in bond yields was already underway; the survey just hadn't caught up yet.
Now the math that connects the CPI headline to your wallet. Between the September 10 and September 24 Freddie Mac readings, the 30-year average rose from 6.76% to 7.03% — 27 basis points, in the two weeks bracketing a warm CPI print and a Fed hike. On a $300,000 loan — right around Jacksonville's median sold price — 7.40% (30-year, week ended October 15, 2026) means $2,077.14 a month in principal and interest. A quarter-point higher, 7.65%, means $2,128.54 — $51.40 more every month, roughly $18,500 over 30 years. The numbers in the data releases are abstractions; that $51 a month is what they mean at your kitchen table.
What should you actually DO with this information?
Here is the honest posture:
- Get preapproved now — don't wait for the October 27–28 meeting. A preapproval is not a promise to lend; it's positioning. If rates dip on a dovish surprise, you can move. If they climb, you're already in the pipeline. Waiting costs you the option to act.
- Talk lock/float strategy with your broker before the decision points. With a Fed meeting six days out and another CPI print in mid-November, this is exactly the window where a lock decision matters. A broker shopping 200 lenders can show you the full structure — seller concessions, lender credits, temporary buydowns — that changes your effective rate far more than the day-to-day market twitch.
- Remember your exits. If you buy at 7.40% (30-year, October 15, 2026) and rates fall later, refinancing is the release valve — FHA borrowers have the streamline with no appraisal, VA borrowers have the IRRRL. Today's rate is a starting position, not a life sentence.
- Don't let one lender's quote be the final word. We work the actual agency guidelines — VA, FHA, Fannie Mae, Freddie Mac — not bank overlays, and we shop 200 lenders. If one lender tells you your file doesn't work at these rates, that's one lender's overlay talking. Always apply.
The inflation data will do what it does. Your move is to understand the mechanism, respect the calendar, and position yourself before the decision points arrive. Education is the edge — people who understand why rates move make better timing decisions than people who just watch the number and look the other way.
Discussion question: When you see an inflation headline, do you think about what it means for your mortgage — or does the number just sail past? What's the one piece of the inflation-to-rate chain that surprised you most?
Start Here
If you're buying, refinancing, or just want to understand where you stand before the Fed meets October 27–28, start with the 60-second check: Run the 60-second rate check — or apply now and we'll shop 200 lenders against the actual agency guidelines to find your fit.
Douglas Wilkerson — NMLS #1680719
Mortgage Broker | Edge Home Finance, NMLS #891464
Direct: (904) 517-4049 | Office: (904) 906-8869
[email protected] | [email protected]
1548 the Greens Way, Ste. 4, Jacksonville Beach, FL 32250
Freeman Douglas Corporation is a DBA of Edge Home Finance. This is not a promise to lend — all credit decisions are subject to approval. Douglas Wilkerson, NMLS #1680719 | Edge Home Finance, NMLS #891464. Verify licensing at nmlsconsumeraccess.org. Equal Housing Opportunity.
